Author: sznbone Release date: Dec 05, 2025
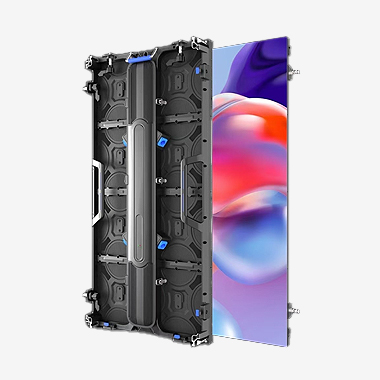
LED screen data visualization displays are specialized tools for transforming complex datasets into clear, actionable visual insights, widely used in corporate boardrooms, data centers, financial institutions, and research labs. These screens are engineered for precision: high resolution (4K or 8K) to render detailed charts, graphs, and heatmaps, and wide color gamuts to distinguish between data categories with subtle color coding. They also support high refresh rates (60Hz+) to ensure smooth rendering of real-time data streams, such as stock market fluctuations or website traffic metrics.
The core value of these displays lies in their ability to simplify complexity. For example, a financial analyst team can use a large LED data visualization screen to display real-time stock market data as interactive line charts, with the ability to zoom in on specific timeframes or compare multiple stocks side-by-side. In a data center, a screen might show server performance metrics as color-coded heatmaps—red for overloaded servers, green for optimal performance—letting IT teams quickly identify and address issues. Many screens integrate with data analytics software like Tableau or Power BI, enabling seamless import of datasets and automatic updates as new data is generated.
Collaboration is another key feature. Most data visualization LED screens support multi-user input, allowing team members to annotate charts directly on the screen using touch or stylus tools. For remote teams, screens can connect to video conferencing platforms, letting off-site members view and interact with data in real time. Some advanced models also offer 3D data visualization capabilities—useful for industries like architecture or healthcare, where 3D models of buildings or medical scans need to be analyzed in detail. By turning raw data into intuitive visuals, LED screen data visualization displays help decision-makers quickly grasp trends, identify patterns, and make data-driven choices, boosting efficiency and accuracy across industries.


Copyright © 2026 Shenzhen Cogo Technology Co.,Ltd.
All Rights Reserved

 Previous article